
Verification of the immortal DNA strand hypothesis: the dilution of the label in adult mice demonstrated by NanoSIMS shows the random segregation of DNA strands and allows for the rejection of this hypothesis.
In this article in the journal NATURE, the authors tested the "immortal DNA strand hypothesis" (immortal strand hypothesis). This hypothesis predicts that during asymmetric stem cell division, chromosomes containing older template DNA are segregated to the daughter cell destined to remain a stem cell, thus ensuring genetic stability throughout life. After labeling with 15N-thymidine from pregnancy to 8 weeks postpartum, we did not observe any retention of the 15N label in dividing small intestinal epithelial cells after four weeks of monitoring. In adult mice injected with 15N-thymidine using a pulse-chase method, we found that proliferating small intestinal epithelial cells diluted the 15N label, consistent with random strand segregation.
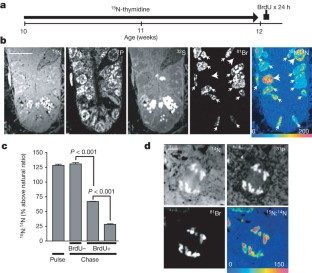
The image above:
a, One of many experimental procedures in the article: 15N-thymidine was administered for 2 weeks to adult mice, followed by BrdU administration for 24 hours before euthanasia.
b, Results of the analysis after procedure a): parallel imaging of elements 14N (proteins), 31P, 32S, 81Br (from BrdU, marking dividing cells), and the 15N/14N ratio (labeled DNA strands, with natural level in dark blue)
CELLS ARE DIVIDING (BRDU1) DILUTION OF 15N-THYMIDINE LABEL (SMALL ARROW) COMPARED TO NON-DIVIDING CELLS (BRDU2) (LARGE ARROW).
Note: two CBC cells with elongated nuclei appear at the bottom of the intestinal crypt. Scale bar: 10 µm.
Below:
c, Divided intestinal crypt cells (BrdU1), located at the CBC position or positions from 14-10, indicate THE DILUTION OF 15N CORRESPONDING TO ONE OR TWO CELL DIVISION CYCLES DURING THE CHASE (CHASE).
d, Intestinal crypt cells are undergoing mitosis. The separating chromosomes are clearly visible in the 14N and 31P images. The 15N label and BrdU are measured in both sets of separating chromosomes, and this result is consistent with symmetrical chromosome segregation. Scale bar: 2 µm.
Excerpt from: Multi-isotope imaging mass spectrometry quantifies stem cell division and metabolism. Matthew L. Steinhauser, Andrew P. Bailey, Samuel E. Senyo, Christelle Guillermier, Todd S. Perlstein, Alex P. Gould, Richard T. Lee & Claude P. Lechene. NATURE journal, vol. 481, January 26, 2012.